
Key takeaway
A buyer of a small SaaS business is really asking one question: will this revenue still be here in a year? Seven numbers answer it. They are monthly recurring revenue, growth, churn, net revenue retention, gross margin, customer concentration and profit.
Of these, churn, gross margin and concentration usually move the price most. In VALUERAQ's default rules, monthly churn alone can move the multiple by 10% in either direction, and one customer providing over 30% of revenue takes 12% off. The multiples in this guide are VALUERAQ's default assumptions, described in the methodology. They are not market data, and a real buyer may pay more or less.
Why buyers start with metrics, not the product
A founder often leads with features. A buyer leads with a spreadsheet. Features matter, but the numbers show whether customers actually keep paying. The U.S. Small Business Administration tells buyers of existing businesses to carry out a "thorough, objective investigation" and to consider hiring an attorney and an accountant (SBA). For a subscription business, that investigation begins with the metrics below.
If you are selling, have these numbers ready before you list. If you are buying, ask for each of them, and ask how they were calculated. The wider process is in the due diligence guide.
The seven metrics, one by one
1. Monthly recurring revenue (MRR)
Stripe describes MRR as "the total amount of money a company can expect to receive from its existing customers each month" (Stripe). See MRR for the basics.
What buyers check:
- Only subscription revenue counts. One-off setup fees, consulting and annual prepayments counted as a single month are all removed.
- Annual plans are spread over 12 months. A $1,200 yearly plan adds $100 to MRR, not $1,200.
- The month-by-month trend. They want 12 or more months, split into new, expansion, contraction and churned MRR.
VALUERAQ turns MRR into ARR by multiplying by 12. For $10,000 of MRR, ARR is $120,000.
2. Growth
Growth shows where ARR is heading. VALUERAQ compares the latest three months with the same three months a year earlier. A steady climb is worth more than one strong quarter, and a decline is a warning. In the default rules, growth above 25% to 75% adds 15% to the multiple, flat revenue adds nothing, and a fall of more than 20% takes 25% off.
3. Churn
Stripe defines churn as "the percentage of total customers who discontinue using a product or service during a given period" (Stripe). Read more at churn and revenue churn.
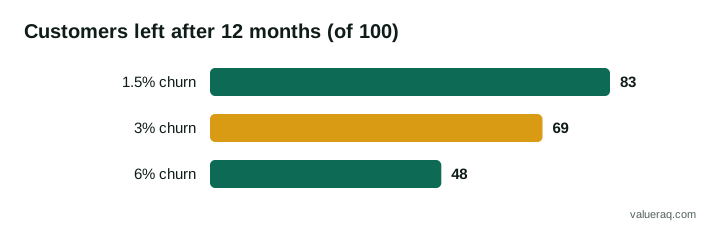
Churn compounds, so a monthly figure that looks small is not small over a year. The table shows what each monthly rate means, using simple arithmetic on 100 customers at the start.
| Monthly churn | Customers left after 12 months (of 100) | Customers lost in a year | Average lifetime (1 ÷ churn) |
|---|---|---|---|
| 1.5% | 83 | 17% | about 67 months |
| 3% | 69 | 31% | about 33 months |
| 6% | 48 | 52% | about 17 months |
The "left after 12 months" figure is 100 × (1 − churn)^12, for example 100 × 0.97^12 = 69. It ignores new customers, so it shows how much has to be replaced just to stand still.
VALUERAQ's default rules treat 2% to 5% monthly churn as the baseline, under 2% as a +10% effect, above 5% to 8% as −10%, and above 8% as −20%.
4. Net revenue retention (NRR)
Stripe describes net revenue retention as "the percentage of revenue that is retained from existing customers over a given period of time" (Stripe). The usual formula is:
NRR = (starting MRR + expansion − contraction − churned MRR) ÷ starting MRR
Example: you start the month with $10,000 of MRR from existing customers. Upgrades add $600, downgrades remove $200, and cancellations remove $400.
- NRR = ($10,000 + $600 − $200 − $400) ÷ $10,000 = 100%
- Gross revenue retention, which leaves out expansion, is ($10,000 − $200 − $400) ÷ $10,000 = 94%
An NRR of 100% means existing customers pay the same as before, so new sales are pure growth. Below 100%, the business shrinks without new sales. See net revenue retention and expansion revenue. Ask also for a cohort analysis, which shows whether customers who joined in the same month stay.
5. Gross margin
Gross margin is revenue minus the direct costs of serving customers (hosting, payment fees, support tools, model or API usage), divided by revenue. If revenue is $10,000 and direct costs are $1,800, gross margin is 82%. See gross margin.
In VALUERAQ's default rules, 70% to 80% is the baseline, above 80% adds 5%, 50% to under 70% takes 7% off, and under 50% takes 15% off. Low margin matters because it caps how much profit growth can ever produce.
6. Customer concentration
If one customer pays a large share of revenue, losing them is a big event. The default rules take 6% off the multiple when one customer provides over 15% to 30% of revenue, and 12% off above 30%. Ask for revenue by customer for the last 12 months. See customer concentration.
7. Profit
Small SaaS buyers often weigh profit as heavily as ARR. VALUERAQ values SaaS on ARR, then shows the midpoint as a multiple of annual profit as a cross-check. A much higher figure means the price relies on growth continuing. A loss-making business should expect offers toward the low end. Profit here means SDE, the earnings before the owner pays themselves, so a buyer will ask what the founder's time is worth.
A worked example
A SaaS business has these figures: MRR $10,000, monthly net profit $4,000 (SDE), revenue up 30% over the year, monthly churn 3%, gross margin 82%, the largest customer 8% of revenue, three years old, and the owner working 25 hours a week.
ARR is $10,000 × 12 = $120,000. Using VALUERAQ's default SaaS range (2.0× low, 3.5× midpoint, 5.0× high) and its published adjustments:
| Factor | Band | Effect |
|---|---|---|
| Business age | 3 years | 0% |
| Revenue trend | Up 30% | +15% |
| Owner involvement | 25 hours a week | −5% |
| Customer concentration | 8% | 0% |
| Churn | 3% | 0% |
| Gross margin | 82% | +5% |
The combined factor is 1.15 × 0.95 × 1.05 = 1.147. The midpoint multiple is 3.5 × 1.147 = 4.01, so the midpoint value is $120,000 × 4.01 = about $482,000. The range runs from about $275,000 to $688,000.
As a cross-check, annual profit is $4,000 × 12 = $48,000, so the midpoint is about 10 times profit. That is high compared with the 3 to 5 times that VALUERAQ notes profit-focused buyers often compare against (a platform assumption, not market data), which shows the price depends on growth continuing.
Now change one metric at a time and keep the rest as above:
| Case | What changes | Midpoint multiple | Midpoint value |
|---|---|---|---|
| Base | Nothing | 4.01× | $482,000 |
| Better retention | Churn 1.5% (+10%) | 4.42× | $530,000 |
| Worse retention | Churn 6% (−10%) | 3.61× | $434,000 |
| Concentrated | Largest customer 35% (−12%) | 3.53× | $424,000 |
| Thin margin | Gross margin 60% (−7%) | 3.56× | $427,000 |
| No growth | Revenue flat (0%) | 3.49× | $419,000 |
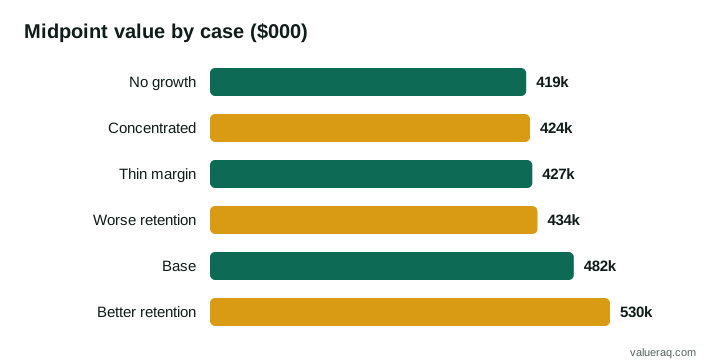
The gap between the best and worst case is $111,000 on the same $120,000 of ARR. The point is that the quality of the revenue matters as much as its size. These numbers are an illustration under VALUERAQ's default assumptions, not a prediction of any sale price.
Putting the metrics together: a quick health check
Two simple tests help a buyer see the whole picture.
The Rule of 40. Corporate Finance Institute writes it as "Rule of 40 = Revenue Growth Rate (%) + Profit Margin (%)" and calls 40% or higher the target (CFI). CFI also warns that it "oversimplifies a company's financial prospects by focusing on just two metrics." In our example, growth of 30% plus a profit margin of 40% ($4,000 ÷ $10,000) is 70. Use it as a quick screen, not a verdict. See Rule of 40.
Payback and lifetime value. If you know what it costs to win a customer (CAC) and how much a customer pays over their lifetime (LTV), the payback period shows how fast that cost comes back. At 3% monthly churn the average lifetime is about 33 months, so a customer paying $50 a month is worth roughly $1,650 in revenue before costs.
How buyers verify the numbers
A buyer should not rely on a spreadsheet the seller built. Typical checks:
- Payment processor reports. Revenue and refunds straight from the source, not a summary.
- Subscription exports. A list of customers with start dates, plan, price and cancellation date, which lets the buyer rebuild churn and cohorts.
- Bank statements. They should match the processor payouts.
- Tax returns and financial statements. The SBA lists financial statements and tax returns among documents a buyer should evaluate.
- Cost records. Hosting, tools and contractor invoices, to check the gross margin and the add-backs. BizBuySell warns that "some add-backs can unrealistically overvalue the company" (BizBuySell).
More on documents is in what documents buyers ask for.
Common mistakes with SaaS metrics
- Mixing customer churn and revenue churn. Losing five small customers is not the same as losing one large one. Report both.
- Counting annual prepayments as MRR. Spread them over 12 months.
- Quoting the best month. Show 12 months or more.
- Hiding concentration. A buyer will find it in the customer list anyway.
- Using a different definition for each metric. Write down how each is calculated and keep the same method month to month.
How to use this on your own business
Pull 12 months of MRR, count new, expansion, contraction and churned amounts, and work out churn, NRR and gross margin. Enter MRR, growth, churn, margin and customer concentration into the SaaS Valuation Tool to see each adjustment applied. For the full method read how to value a SaaS business and SaaS valuation multiples. If you plan to sell, see how to sell a SaaS business, and if you plan to buy, how to buy a SaaS business.
Frequently asked questions
What SaaS metrics do buyers care about most?
MRR and its trend come first, then churn, net revenue retention, gross margin, customer concentration and profit. In VALUERAQ's default rules, churn, margin and concentration have some of the largest effects on the multiple after growth.
What is a good churn rate for a small SaaS business?
There is no single answer, because it depends on the customers and the price. VALUERAQ's default rules treat 2% to 5% monthly churn as the baseline and under 2% as a positive sign. Compare your own figure with your own past, and expect a buyer to ask how it has changed.
How is net revenue retention different from churn?
Churn counts what you lose. Net revenue retention also counts what existing customers add through upgrades, so it can be above 100% even when some customers leave.
Do buyers want to see metrics from the payment processor?
Yes. A buyer will usually ask for reports straight from the payment processor and the subscription system, and will compare them with bank statements.
Sources
- U.S. Small Business Administration: Buy an existing business or franchise
- Stripe: Essential SaaS metrics
- Corporate Finance Institute: The SaaS Rule of 40
- BizBuySell Learning Center: Add-backs for Seller's Discretionary Earnings
- VALUERAQ methodology
Next step
Enter your own MRR, growth, churn and margin in the free SaaS Valuation Tool to see how each metric moves the range.
Written by VALUERAQ Editorial Team. The VALUERAQ editorial team writes and maintains the platform's guides, methodology and glossary. Every guide is reviewed against the published methodology before publication and when the methodology changes.