Key takeaway
A buyer will find the drop. Every buyer opens the monthly numbers, and a dip stands out on a chart within seconds. What decides the price is not the drop itself but whether you explained it first, with proof. A seller who says "revenue fell in months 7 to 12, here is why, and here is the recovery" keeps trust. A seller who waits for the buyer to find it loses trust, and a buyer who loses trust asks for a lower price or leaves.
This guide gives you a five-step script, a table of proof a buyer will accept, and a worked example with the arithmetic. The figures in the example are made up to show the method. Multiples come from VALUERAQ's published default ranges on the methodology page, not from market data, and nothing here guarantees a price.
Why a drop changes the price
Buyers of small online businesses pay for earnings they expect to keep. A falling line makes them ask one question: "Is this the start of a slide, or a bump?" If you cannot answer, they assume the worse case, because the worse case is the one that costs them money.
There is also a plain arithmetic reason. Buyers often look at more than one way to measure earnings:
- Trailing twelve months. The last 12 months added up. The Corporate Finance Institute describes it as the latest fiscal year plus the current year to date, minus the same period a year earlier. Our trailing twelve months page explains it.
- Recent run rate. The latest month or quarter turned into a yearly figure. The Corporate Finance Institute says a run rate "takes a company's current revenue in a certain period (a week, month, quarter, etc.) and converts it to an annual figure," and lists its risks: it assumes conditions stay unchanged, and it can be thrown off by seasonality and one-off events. See run rate.
After a drop, these two numbers disagree. The trailing figure still contains the good months, so it looks better. The run rate looks only at the bad months, so it looks worse. The buyer will lean toward the lower one unless you give a reason not to. Your job is to give that reason.
Step 1: Tell the buyer first
Raise the drop in your listing notes or your first call, before the buyer opens the spreadsheet. One honest sentence is enough: "Revenue was lower from June to November; here is the cause and what has happened since."
Why this works:
- It shows you are not hiding anything, which makes the rest of your numbers easier to believe.
- It lets you set the frame. If the buyer finds the dip alone, the buyer sets the frame.
- It saves time. Buyers who would walk away over a dip walk away early, and the serious ones stay.
Do not hide, smooth or shorten the date range to cut out the weak months. Buyers ask for monthly figures, and the U.S. Small Business Administration tells anyone buying an existing business to carry out a "thorough, objective investigation". Cutting out months is the quickest way to end a deal. Our guide on how to prove your revenue to a buyer covers the records that back up your numbers.
Step 2: Name the cause in one sentence
Buyers do not need a long story. They need a clear cause they can test. Pick the cause that is true, not the one that sounds best.
| Common cause | What the buyer will want to see | Likely buyer view |
|---|---|---|
| A one-off event (a refund wave, a supplier stockout, a failed payment link) | Dates of the event, proof it is fixed, normal months before and after | Mild: the buyer may discount only the affected months |
| A ranking or traffic change from a search engine | Traffic by channel, the date it began, what you changed since | Cautious: the buyer will wonder if it can happen again |
| Seasonality | Same months in earlier years showing the same pattern | Neutral, if the earlier years prove it. See seasonal business valuation |
| Losing one large customer or ad partner | Contract end date, share of revenue it was, what replaced it | Serious: see customer concentration |
| You cut back effort or ad spend before selling | Honest statement of what stopped and what restarting costs | Cautious, but fixable by a buyer who plans to work harder |
| A market or product change | Evidence that the market itself moved, and your plan | Depends on the plan |
If you do not know the cause, say so, and show what you have checked. "I do not know yet" with a list of checks is more believable than a guess that falls apart in diligence.
Step 3: Prove it with month-by-month numbers
A paragraph proves nothing. A table of months does. Build a simple sheet that shows, for at least 24 months where you have them:
- Revenue by month, from your payment processor or ad network, not from memory.
- Costs by month, so the buyer sees whether profit fell with revenue or faster.
- Traffic or customers by month, to link the cause to the numbers.
- A line marking the date the drop began and the date any fix went in.
Put the sources behind it in your data room: payout statements, analytics exports and bank records. A buyer will check that the sheet and the statements agree. If you are not sure how far back buyers look, our guide on how many months of data buyers want explains it.
| Proof | What it shows | Where it comes from |
|---|---|---|
| Monthly revenue for 24 months | When the drop began and how deep it went | Payment processor, ad network or marketplace payouts |
| Traffic or order count by month | Whether the cause lines up with the drop | Analytics export |
| Costs by month | Whether margin held | Bank or accounting records |
| Dated change log | What you changed and when | Your own notes, emails, tickets |
| Same months in earlier years | Whether it is seasonal | Earlier exports |
Step 4: Separate one-offs from lasting changes
This is the step that moves the price most. A buyer will price lasting changes and may overlook one-offs, but only if you show which is which.
A one-off is something that will not repeat: a payment link broken for three weeks, a single large refund, a supplier that has since been replaced. In earnings terms, this works like an add-back, a cost or loss that the buyer should not count as normal running. BizBuySell's guide warns that "some add-backs can unrealistically overvalue the company," so be ready to document each one. Normalized earnings explains how adjusted figures are built and why buyers check them.
A lasting change is something that is likely to keep pulling revenue down: a lost partner, a product that is losing customers, a channel that has stopped working. Do not call a lasting change a one-off. A buyer who finds out in diligence will assume you were hiding it, and the deal usually ends there.
Ask three questions about each cause:
- Will it happen again? If the answer is "possibly," say so and say what protects the buyer.
- Is it fixed, and how do I know? Show the first recovered months, not a promise.
- Does it affect the whole business or one part? A drop in one product line is easier to explain than a drop across the board.
Step 5: Show what you have done since
A buyer buys the future, so show motion. Evidence that counts:
- Two or three recovered months, with the figures.
- A dated list of fixes: new traffic sources, a repaired checkout, a replaced supplier, new content published.
- A short note on what a new owner should do in the first 90 days to protect the recovery. Our guide on documenting your business before selling shows how to write it.
If recovery has not started, say that too, and show the plan. Then expect a lower price, and consider whether waiting to sell makes sense. Our guide on when to sell an online business looks at the timing question.
Worked example: what a dip does to the price
The figures below are made up. A seller runs a content website. For the first six months of the last year, profit was $4,000 a month. After a traffic drop, it fell to $3,000 a month for the next six. Over the last three months, profit has recovered to $3,500 a month.
The multiple used is VALUERAQ's default mid multiple for a website, 3.2x annual profit (the published default range is 2.5x to 4.0x, see methodology). This is a teaching figure, not a market price.
Trailing twelve months:
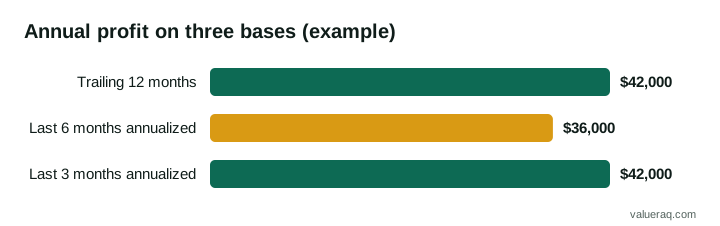
6 months × $4,000 = $24,000 6 months × $3,000 = $18,000 Total = $42,000
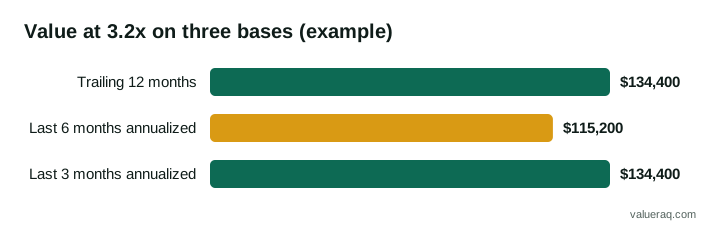
Value on that figure: $42,000 × 3.2 = $134,400
Recent run rate, using only the last six months:
$3,000 × 12 = $36,000
Value on that figure: $36,000 × 3.2 = $115,200
The gap is $134,400 − $115,200 = $19,200, which is about 14% of the higher figure. That is what a buyer who anchors on the dip could ask you to give up.
Now add the recovery proof. If you show three recovered months at $3,500, the run rate on those months is $3,500 × 12 = $42,000. That matches the trailing figure, and $42,000 × 3.2 = $134,400 again. With documents behind it, the buyer has less reason to discount the whole gap.
| Basis the buyer uses | Annual profit | Value at 3.2x |
|---|---|---|
| Trailing 12 months | $42,000 | $134,400 |
| Last 6 months, annualized | $36,000 | $115,200 |
| Last 3 months (recovered), annualized | $42,000 | $134,400 |
A buyer may still pay somewhere between the lower and higher figures. Real offers depend on the cause, how much of the business is exposed to it, and how much proof you show. The example shows only how much the explanation is worth: here, up to $19,200 on a $134,400 business.
What not to do
- Do not blame the buyer's tools. "Your numbers are wrong" ends the conversation.
- Do not promise a rebound. Say what has happened and what you have done. A buyer will not accept a forecast as proof, and a promise you cannot keep can turn into a dispute after closing.
- Do not change the story between calls. Buyers compare notes with their own advisers. Write the explanation once and reuse it.
- Do not hurry a bad month into a good one. Moving revenue between months, or pausing costs to lift profit, will show up in bank records.
- Do not skip the tool check. Before you talk price, run your recent profit through a valuation tool to see where a buyer is likely to start. The free Website Valuation Tool takes about a minute.
A short script you can adapt
"Revenue was lower from June to November. The cause was [one sentence]. The monthly figures and the records behind them are in the data room. [One-off or lasting, and why.] Since then I have [fix], and the last three months show [figures]. I priced the business on [basis], and I am happy to walk through the numbers on a call."
Short, specific and checkable. Cut anything you cannot back with a document.
Frequently asked questions
Should I wait until revenue recovers before selling?
It depends on the cause and the trend. If recovery has started and is documented, waiting a few months can give a buyer more proof and may close the gap shown in the example. If the decline is lasting, waiting rarely helps, and the better move may be to sell with an honest explanation or fix the cause first. Whatever you choose, do not list the business while hiding a decline you already know about.
Will a buyer use my best year or my worst quarter?
Usually neither. Buyers look at several measures and often lean toward the lower, more recent one when earnings are falling, because it is the more cautious number. That is why your explanation matters: it gives the buyer a reason to treat the dip as temporary.
How far back should the numbers go?
Show every month you can document, and at least 24 months if you have them, so the buyer sees the dip against a normal year. The buyer will ask for monthly figures backed by statements, and a longer history makes it easier to show whether a dip is seasonal.
Can I just leave the weak months out?
No. Buyers check statements against your sheet, and a gap in the dates is a warning sign. Leaving out the weak months can end a deal and, if a buyer relied on figures you knew to be incomplete, it can create legal trouble. Ask a lawyer if you are unsure what you must disclose.
Does a revenue drop mean my business is unsellable?
No. Businesses are bought with dips in their history. A dip changes the price and the questions, not whether a sale is possible. Clear causes, clean records and early honesty are what keep a deal alive.
Sources
- U.S. Small Business Administration, Buy an existing business or franchise
- Corporate Finance Institute, Revenue Run Rate
- Corporate Finance Institute, Trailing Twelve Months (TTM)
- BizBuySell Learning Center, Add-Backs for Seller's Discretionary Earnings
Next step
Enter your recent profit to see how a dip moves the range before you talk to a buyer.
Written by VALUERAQ Editorial Team. The VALUERAQ editorial team writes and maintains the platform's guides, methodology and glossary. Every guide is reviewed against the published methodology before publication and when the methodology changes.