Key takeaway
A seasonal business is valued on a full cycle, not on its best or worst stretch. For a store, a blog or an app with a busy season, that cycle is almost always twelve months. Add up every month, divide as needed, and put the multiple on that total.
Two mistakes pull the number in opposite directions. A seller who lists right after the busy season and multiplies the peak by four makes the business look richer than it is. A buyer who takes the quietest month and multiplies it by twelve makes it look poorer. A full year of figures settles both arguments.
This guide covers why twelve months is the standard, a worked example with the arithmetic shown, how a seller can show a peak honestly, and what a buyer should ask. For the short definitions, see seasonality and trailing twelve months. This page goes further into the price effect and does not repeat them.
Why buyers want a full 12 months
A multiple is applied to earnings that are expected to continue. The Corporate Finance Institute describes the revenue run rate method as taking a company's current revenue in a certain period and converting it to an annual figure, and it lists seasonality among that method's risks, along with the assumption that conditions stay unchanged and the effect of one-off events. In the same way, its multiples analysis warns that the approach only considers the company's position for a certain time period.
Both warnings point the same way. A single month or quarter shows one moment of the year. A seasonal business has at least two very different moments, so one slice of it cannot stand for the whole.
Twelve months fixes this because every season appears exactly once. The peak and the quiet stretch both count, in the proportion they really occur. That is why trailing twelve months is the usual period for small-business valuation, and why VALUERAQ's tools ask for the average of the last 12 months rather than the latest month.
Three ways to get the annual figure, and what each gets wrong
| Method | How it works | Effect on a seasonal business |
|---|---|---|
| Trailing twelve months | Add the last 12 full months | Fair: every season counted once |
| Peak run rate | Take the best month or quarter and scale it to a year | Overstates profit |
| Quiet-period run rate | Take a slow month and scale it to a year | Understates profit |
The second row is the one sellers are tempted by, and the third is the one a buyer can raise as a negotiating point. Neither is wrong arithmetic. Both are wrong method, because they ignore that the business is not the same in every month.
Worked example: a gift store
The figures below are invented to show the arithmetic. They are not market data.
A hypothetical online gift store earns $2,500 of net profit in each of nine quiet months, and $9,000 in each of three peak months (October to December).
Trailing 12 months profit = (9 × $2,500) + (3 × $9,000) = $22,500 + $27,000 = $49,500.
Now compare what happens if either side picks a single slice:
- Peak quarter scaled up. The three peak months earned $27,000. Multiplying by four gives $27,000 × 4 = $108,000.
- Quiet month scaled up. One quiet month earned $2,500. Multiplying by twelve gives $2,500 × 12 = $30,000.
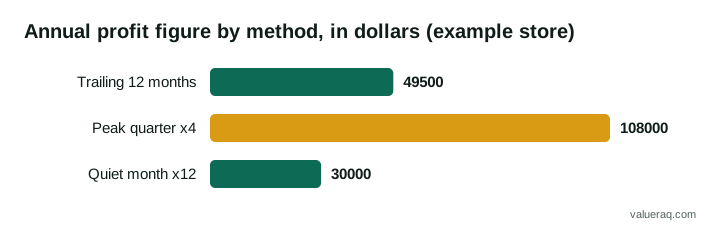
The honest figure, $49,500, sits well between the other two. The peak figure is $108,000 − $49,500 = $58,500 too high. The quiet figure is $49,500 − $30,000 = $19,500 too low.
What each figure does to the price
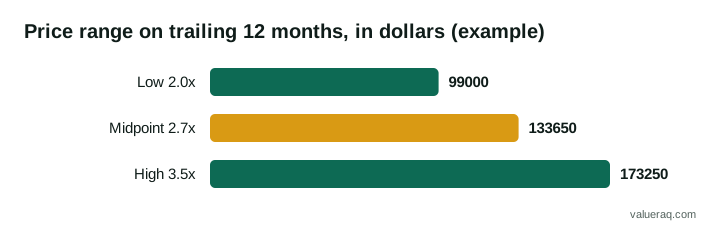
VALUERAQ's default range for an ecommerce business is 2.0x to 3.5x annual net profit, with a midpoint of 2.7x, before adjustments. These are VALUERAQ editorial assumptions, not market data. The methodology explains where they come from and how they are adjusted. Applied to the trailing figure:
- Low: $49,500 × 2.0 = $99,000
- Midpoint: $49,500 × 2.7 = $133,650, shown as about $134,000
- High: $49,500 × 3.5 = $173,250
Now suppose a seller lists in January and applies the same midpoint to the peak-quarter figure: $108,000 × 2.7 = $291,600. That is $291,600 − $133,650 = $157,950 above the trailing-twelve-months midpoint, for a business that did not earn the profit behind it. A buyer who checks the monthly records will see this in minutes, and the seller will have lost credibility on every other number.
How to show a peak honestly
If you are the seller, your goal is a buyer who trusts the number. A seasonal peak is not a flaw. Hiding or inflating it is.
Give all twelve months, not a summary. A table of monthly revenue and profit takes up little space and answers the first question before it is asked. Better still, give two years if you have them, so the buyer can see that the peak repeats.
Set each month beside the same month a year earlier. Comparing December with November tells a buyer nothing, because the jump is expected. Comparing December with last December shows whether the business is really growing. This is also how the VALUERAQ growth input works: it asks for the latest three months against the same three months a year earlier.
State how much of the year the peak provides. In the example, the three peak months earned $27,000 of $49,500, which is $27,000 ÷ $49,500 = 54.5% of annual profit. Saying so plainly shows you understand the risk. A buyer who sees that more than half the year's profit lands in a quarter will think about cash, stock and what happens if one holiday season goes badly.
Mark one-off events. A viral mention, a large wholesale order or a stock clearance can sit inside a peak month and make it look repeatable when it is not. Say what it was and show the figure without it. Valuation mistakes lists this among the common errors.
What a buyer should ask
If you are the buyer, the questions below test whether the annual figure is as solid as it looks.
- What are the monthly results for the last 24 months? One year can hide a weak season. Two years show whether the pattern repeats.
- When does cash go out and when does it come in? Seasonal stores buy stock before the busy period. The cash flow entry explains why profit and cash can differ by months, and inventory turnover shows how quickly stock converts back into sales.
- Which months does the sale fall between? A store sold just after its peak has strong recent figures. A store sold just before it has weak ones. Neither is the whole story, which is why the twelve-month total matters more than the last quarter.
- How much of the profit comes from the peak? A high share is a risk, not a reason to walk away. It should show up in the price you offer and in the cash you hold ready.
- Is advertising or return cost higher in the peak? Costs can swing too. Check that the profit figure is after those costs, using the layout in how to read a profit and loss statement.
The U.S. Small Business Administration, in its guide to buying an existing business, describes a "thorough, objective investigation" and lists financial statements and tax returns among the documents to evaluate, along with existing cash flow and inventory. For a seasonal business, monthly statements are the most useful of those documents. The same guide suggests hiring an accountant to help with the review.
Inventory and the timing of a sale
For an ecommerce business, stock matters twice. First, the earnings-based price is not the whole picture. VALUERAQ's ecommerce tool shows inventory at cost separately and adds it to a second range, since sellable stock is usually priced on top of the earnings-based figure. Second, a seasonal store needs the right stock at the right time. A buyer who takes over in August will need to buy for the peak within weeks, so the cash for it must be agreed in advance.
The timing of the listing is a choice. A seller who lists soon after the peak shows the best recent numbers and gets full benefit from the trailing figure. A seller who lists before the peak can point to stock already bought and a season about to start, but must expect more questions about whether the season will deliver. The valuing an ecommerce business and Shopify store valuation guides cover the wider checks, and how to sell a Shopify store covers the sale itself.
What VALUERAQ's tools do and do not do
The tools take an average of the last 12 months, so a seasonal business is treated in the way this guide recommends, as one annual figure. The methodology is also clear about a limit: seasonality within the year is not modelled. The tool will not tell you that 54.5% of profit arrives in a quarter or that a buyer should hold extra cash. Those points belong in your listing, in your conversations and in the buyer's own review.
Treat the result as a starting range. It is an estimate, not an appraisal, and it is not financial advice.
Frequently asked questions
Does a seasonal business sell for less?
Not automatically. The price comes from annual profit and the risk a buyer sees. A seasonal business with clear monthly records and a pattern that repeats can be priced like any other. The risk sits in having so much of the year's profit in a short window, and a buyer may allow for it.
What period should I use to value a seasonal business?
Use the last 12 full months, and show 24 months if you have them. A shorter period cannot contain every season, and a longer one may include conditions that no longer apply.
Is it better to sell before or after the peak?
There is no rule. After the peak, the recent figures are strong and the trailing total is complete. Before it, you can show a season about to begin but must support the claim with past years. Whichever you choose, give the buyer all twelve months.
Can I use the latest month times twelve for a quick estimate?
For a seasonal business, no. The result depends on which month you pick. In the example above, the peak quarter gave $108,000 and a quiet month gave $30,000, against a true $49,500.
Sources
- Corporate Finance Institute, Revenue Run Rate: how run rate converts a period to a year, and its risks including seasonality.
- Corporate Finance Institute, Multiples analysis: the point that multiples only consider a certain time period.
- Corporate Finance Institute, Trailing Twelve Months (TTM): the TTM formula.
- U.S. Small Business Administration, Buy an existing business or franchise: investigation, documents to evaluate and professional help.
- VALUERAQ, Valuation methodology: the default ecommerce range and its stated limits.
Next step
To see where a seasonal store lands, enter its 12-month averages in the free ecommerce valuation tool.
Written by VALUERAQ Editorial Team. The VALUERAQ editorial team writes and maintains the platform's guides, methodology and glossary. Every guide is reviewed against the published methodology before publication and when the methodology changes.